
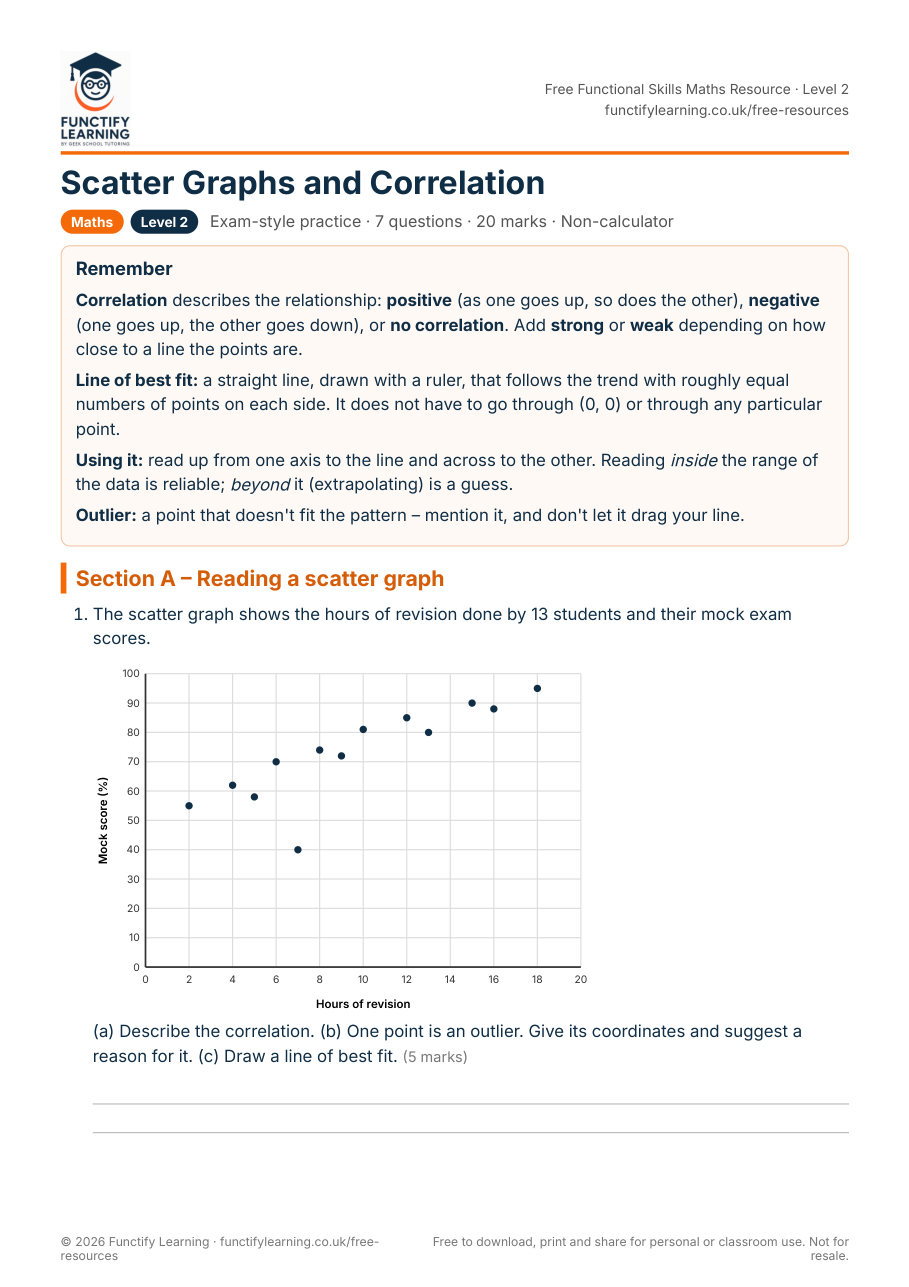
Scatter graphs test whether two things are connected – revision hours and mock scores, temperature and ice-cream sales – and Level 2 questions ask you to describe the correlation, draw a line of best fit and use it sensibly. This free worksheet includes a printed scatter graph to work on and the vocabulary examiners want.
Free to download, print and share for personal or classroom use. Answers included.
What’s in this worksheet
- Section A – Reading a scatter graph (9 marks)
- Section B – Plotting and describing (11 marks)
- Revise box with the rules and methods for the topic
- Worked answers for every question
Common mistakes on this topic
From our tutors’ marking and the most recent examiner reports – check your work against these:
- Describing correlation as just ‘positive’ – add strong or weak, and say what it means in the context.
- Drawing the line of best fit through the first and last points, or forcing it through the origin.
- Reading off the graph without drawing the guide lines – examiners give a mark for the lines.
How to use it
- Print the worksheet (or work on screen) and attempt every question without looking at the answers. Give yourself a rough time limit – Level 2 exams are tight.
- Mark your work against the answer page. For maths, check the method as well as the final number; method marks are where most of the marks are.
- Read the ‘common mistakes’ notes below and check whether any of them happened to you. Then redo the questions you got wrong a day later.
Related free resources
- Two-Way Tables and Probability Worksheet – Functional Skills Maths Level 2
- Comparing Data Sets Worksheet – Functional Skills Maths Level 2
- Level 2 Maths Mini Practice Paper 1 – Functional Skills Maths Level 2
- All free Functional Skills Maths Level 2 resources
Frequently asked questions
What is correlation on a scatter graph?
The relationship between the two variables. Positive correlation: as one increases, so does the other (points rise left to right). Negative: one increases as the other decreases. No correlation: no pattern. Describe it as strong or weak too.
How do you draw a line of best fit?
With a ruler, draw a straight line that follows the direction of the points with roughly as many points above it as below. Ignore obvious outliers. It doesn’t need to pass through any specific point or through the origin.
Does correlation mean one thing causes the other?
No. Ice-cream sales and drownings both rise in summer, but one doesn’t cause the other – hot weather drives both. Exam questions sometimes ask you to spot this.
Want a tutor to mark your work? Not sure where you stand? Take the free 15-minute mini mock test. Ready to get qualified? Our live 10-week Functional Skills Level 2 Maths course runs in small groups with a mock exam included, and the 5-day revision course is there if your exam is close.