
Two-way tables sort data by two things at once – gender and course, age group and response – and Level 2 questions ask you to complete one from a wordy description, then use it for probabilities. This free worksheet covers completing tables, reading probabilities from them, sample-space grids and relative frequency from experiments.
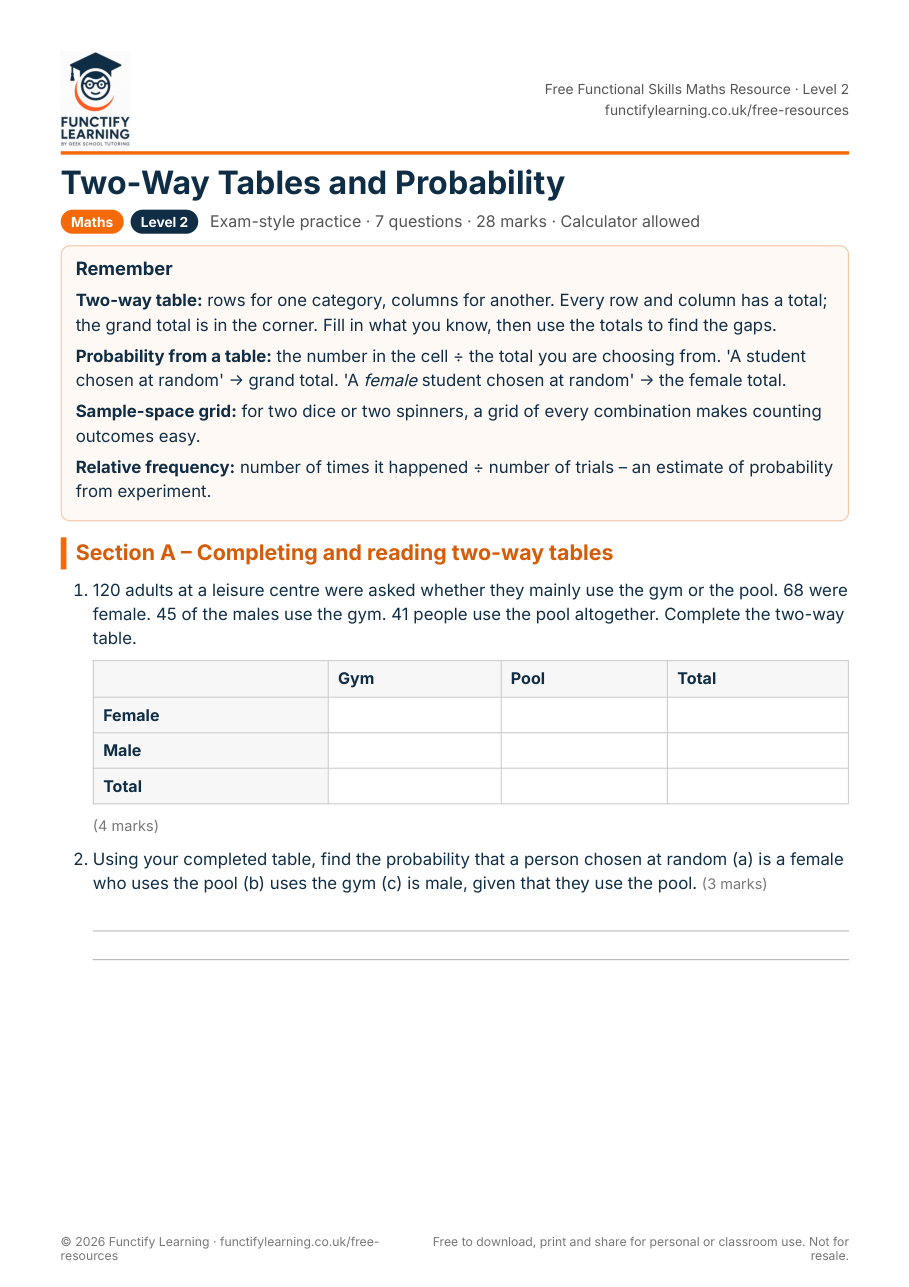
Free to download, print and share for personal or classroom use. Answers included.
What’s in this worksheet
- Section A – Completing and reading two-way tables (12 marks)
- Section B – Sample spaces and relative frequency (16 marks)
- Revise box with the rules and methods for the topic
- Worked answers for every question
Common mistakes on this topic
From our tutors’ marking and the most recent examiner reports – check your work against these:
- Dividing by the grand total when the question says ‘a female is chosen’ – use the female total.
- Filling in a two-way table without checking that every row and column adds to its total.
- Treating a relative frequency from 50 trials as exact – it is an estimate that improves with more trials.
How to use it
- Print the worksheet (or work on screen) and attempt every question without looking at the answers. Give yourself a rough time limit – Level 2 exams are tight.
- Mark your work against the answer page. For maths, check the method as well as the final number; method marks are where most of the marks are.
- Read the ‘common mistakes’ notes below and check whether any of them happened to you. Then redo the questions you got wrong a day later.
Related free resources
- Probability Worksheet – Functional Skills Maths Level 2
- Scatter Graphs and Correlation Worksheet – Functional Skills Maths Level 2
- Level 2 Maths Mini Practice Paper 1 – Functional Skills Maths Level 2
- All free Functional Skills Maths Level 2 resources
Frequently asked questions
What is a two-way table?
A table that sorts data by two categories at once – for example gender down the side and activity across the top – with totals for every row and column. It lets you read off how many people fall into each combination.
How do you find a probability from a two-way table?
Divide the number in the relevant cell by the total you are choosing from. If the question says ‘a person is chosen at random’, use the grand total; if it says ‘a male is chosen’, use the male row total.
What is relative frequency?
An estimate of probability from an experiment: the number of times the event happened divided by the number of trials. 128 point-up landings in 200 drops gives 0.64. The more trials, the better the estimate.
Want a tutor to mark your work? Not sure where you stand? Take the free 15-minute mini mock test. Ready to get qualified? Our live 10-week Functional Skills Level 2 Maths course runs in small groups with a mock exam included, and the 5-day revision course is there if your exam is close.