
A conversion graph is a straight line that turns one unit into another – miles into kilometres, pounds into euros, minutes into cost. Level 2 questions ask you to read it accurately in both directions, use it for values off the end of the axis, and compare two lines to make a decision. This free worksheet does all three, with the graphs printed for you.
Free to download, print and share for personal or classroom use. Answers included.
What’s in this worksheet
- Section A – Miles and kilometres (9 marks)
- Section B – Comparing tariffs (11 marks)
- Revise box with the rules and methods for the topic
- Worked answers for every question
Common mistakes on this topic
From our tutors’ marking and the most recent examiner reports – check your work against these:
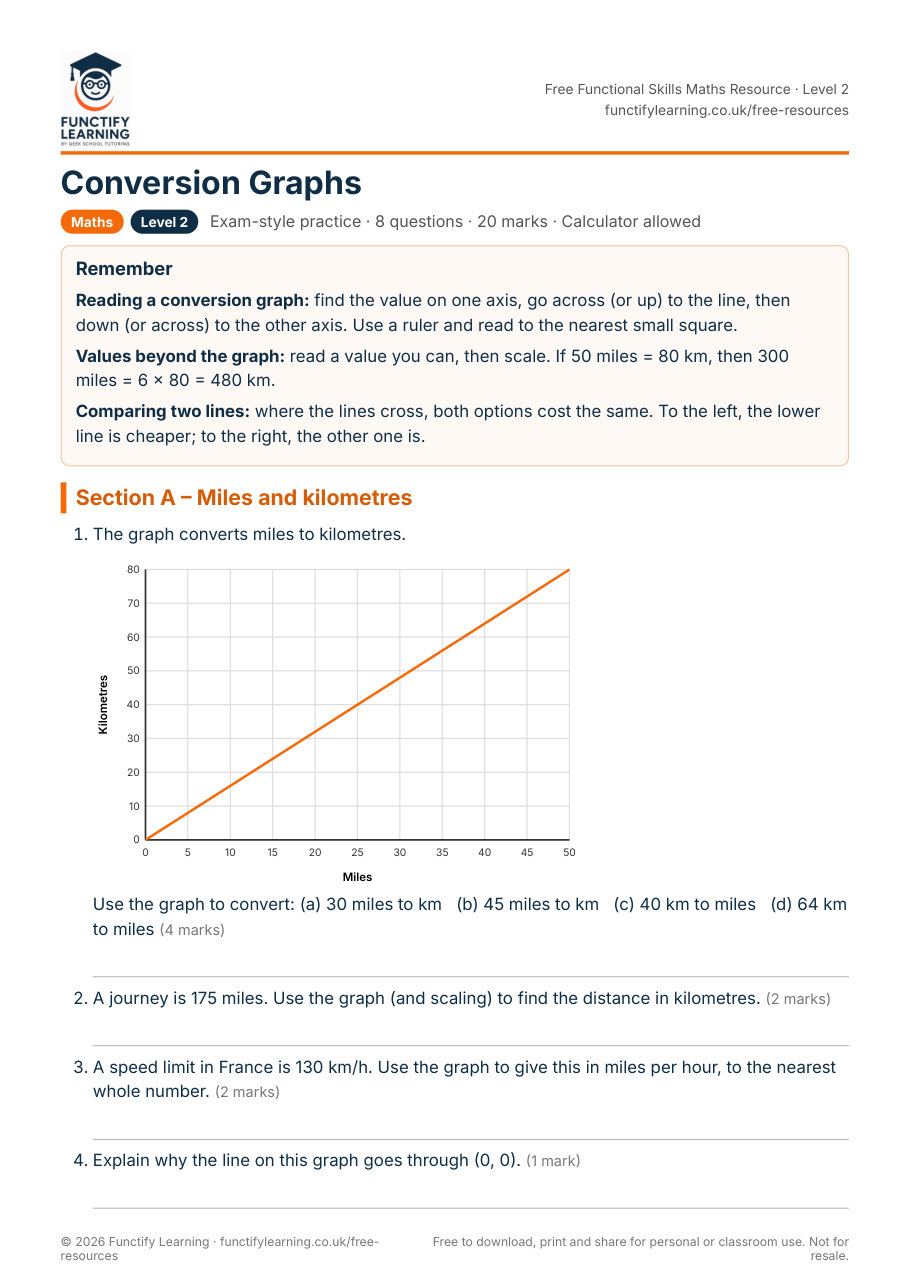
- Reading the wrong axis – going up from 30 on the horizontal axis but reading the answer off the horizontal axis again.
- Not using a ruler, then reading 47 or 49 instead of 48. The exam allows a small tolerance, but sloppy readings drift outside it.
- For values beyond the graph, guessing instead of scaling a value you can read (50 miles = 80 km → multiply).
How to use it
- Print the worksheet (or work on screen) and attempt every question without looking at the answers. Give yourself a rough time limit – Level 2 exams are tight.
- Mark your work against the answer page. For maths, check the method as well as the final number; method marks are where most of the marks are.
- Read the ‘common mistakes’ notes below and check whether any of them happened to you. Then redo the questions you got wrong a day later.
Related free resources
- Unit Conversions Worksheet – Functional Skills Maths Level 2
- Problems Involving Money Worksheet – Functional Skills Maths Level 2
- Level 2 Maths Mini Practice Paper 1 – Functional Skills Maths Level 2
- All free Functional Skills Maths Level 2 resources
Frequently asked questions
How do you read a conversion graph?
Find the known value on its axis, draw a line (with a ruler) to the graph line, then straight across or down to the other axis and read the value. Mark the lines on the graph – examiners award a mark for them.
How do you convert a value that is beyond the end of a conversion graph?
Read a convenient value that is on the graph, then multiply. If 50 miles reads as 80 km, then 200 miles is 4 × 80 = 320 km. Show the reading and the multiplication.
What does it mean where two lines cross on a graph?
At that point both options give the same value – for example two tariffs costing the same for the same number of minutes. On one side of the crossing one option is better; on the other side, the other one is.
Want a tutor to mark your work? Not sure where you stand? Take the free 15-minute mini mock test. Ready to get qualified? Our live 10-week Functional Skills Level 2 Maths course runs in small groups with a mock exam included, and the 5-day revision course is there if your exam is close.